Online or onsite, instructor-led live Microsoft Power BI training courses demonstrate through interactive discussion and hands-on practice how to use Power BI to obtain insights from data in a visual fashion.
Power BI training is available as "online live training" or "onsite live training". Online live training (aka "remote live training") is carried out by way of an interactive, remote desktop. Onsite live Power BI trainings in Katowice can be carried out locally on customer premises or in NobleProg corporate training centers.
Power BI training courses cover how to create compelling dashboards, access data from multiple sources, and build visualizations in collaboration with other team members.
NobleProg -- Your Local Training Provider
Katowice
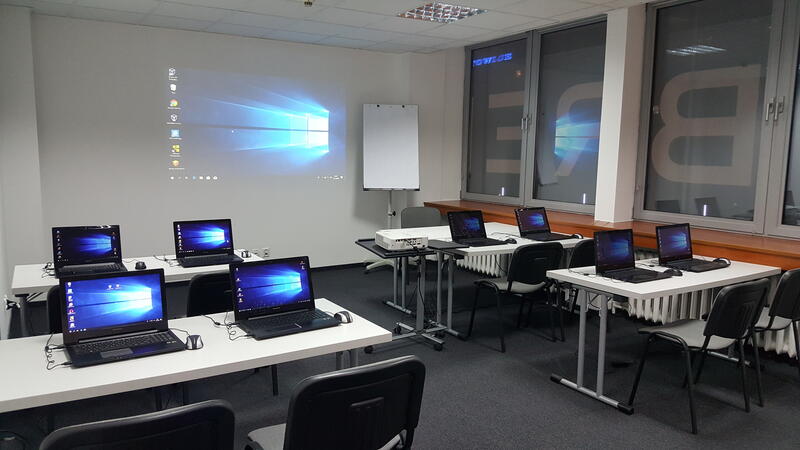
Centrum Szkoleniowe Moniuszki 7, Moniuszki 7, Katowice, Poland, 40-004
The training room is located in the heart of Katowice. Its attractive location in the city center guarantees easy access for all participants. The main railway station is just 500 meters away from our venue, and bus and tram stops are only 100 meters away. Additionally, it has excellent connections to the outbound route towards the A4 motorway to Krakow - Wroclaw and Pyrzowice Airport, making it an ideal venue for participants arriving from various parts of Poland and abroad.
This instructor-led, live training in Katowice (online or onsite) is aimed at beginner-level financial analysts who wish to learn how to use Power BI for data analysis, reporting and dashboard creation, and prepare for Power BI certification (PL-300).
By the end of this training, participants will be able to:
Navigate and use Power BI Desktop and Power BI Service.
Connect to various data sources and transform data using Power Query.
Create interactive dashboards and reports.
Use DAX (Data Analysis Expressions) for calculations and data modeling.
Publish and share reports securely within an organization.
Prepare for Power BI certification (PL-300: Microsoft Power BI Data Analyst).
This instructor-led, live training in Katowice (online or onsite) is aimed at beginner-level to intermediate-level data professionals who wish to create compelling data visualizations and dashboards with Power BI.
By the end of this training, participants will be able to:
Import and transform data from various sources.
Develop and optimize data models.
Create visually appealing and interactive reports and dashboards.
Apply best practices in data visualization and dashboard design.
Utilize advanced features of Power BI for in-depth data analysis.
This instructor-led, live training in Katowice (online or onsite) is aimed at expert-level data analysts who wish to leverage Python's data analysis capabilities within Power BI, enhancing their ability to analyze and visualize data effectively.
By the end of this training, participants will be able to:
Learn how Python can be integrated into Power BI for data analysis.
Use Python scripts to load, clean, and preprocess data within the Power BI environment.
Enhance data visualization capabilities by creating custom and interactive visualizations using Python.
Acquire advanced data analysis skills using Python.
This course will discuss the various methods and best practices that are in line with business and technical requirements for modeling, visualizing, and analyzing data with Power BI. The course will also show how to access and process data from a range of data sources including both relational and non-relational data. This course will also explore how to implement proper security standards and policies across the Power BI spectrum including datasets and groups. The course will also discuss how to manage and deploy reports and dashboards for sharing and content distribution.
This instructor-led, live training in Katowice (online or onsite) is aimed at intermediate-level professionals who wish to gain a comprehensive understanding of Power BI, including its integration with SAP and AI tools to enhance data analysis and reporting.
By the end of this training, participants will be able to:
Navigate Power BI’s interface and integrate it with SAP Business One.
Import, clean, and transform business data for analysis.
Build robust data models and apply DAX for in-depth insights.
Create compelling visualizations and dashboards.
Leverage AI tools like Copilot and ChatGPT for enhanced reporting.
Publish, share, and manage Power BI reports effectively.
This instructor-led, live training in Katowice (online or onsite) is aimed at beginner-level professionals who wish to clean and analyze data, make statistical projections, and create insightful visualizations using these tools.
By the end of this training, participants will be able to:
Understand the basics of Python, R, Power Query, and Power BI for data analysis.
Clean and organize datasets using Python and Power Query.
Perform statistical analysis and projections with R.
Create professional dashboards and reports with Power BI.
Integrate and analyze data from multiple sources effectively.
This instructor-led, live training in Katowice (online or onsite) is aimed at intermediate-level business intelligence professionals who wish to have a comprehensive understanding and practical skill set for integrating PowerBI with SAP B1.
By the end of this training, participants will be able to:
Understand the fundamentals of SAP Business One and PowerBI.
Successfully integrate PowerBI with SAP B1, including setting up the necessary tools and connectors.
Efficiently extract data from SAP B1 and transform it in PowerBI for effective analysis.
Create dynamic and insightful reports and dashboards in PowerBI using data from SAP B1.
This instructor-led, live training in Katowice (online or onsite) is aimed at beginner to intermediate-level business analysts, data analysts, and developers who wish to learn the fundamentals of DAX in Power BI.
By the end of this training, participants will be able to:
Have a comprehensive understanding of Data Analysis Expressions (DAX) in Power BI.
Create custom calculations and expressions in Power BI for analyzing data and deriving insights.
This instructor-led, live training in Katowice (online or onsite) is aimed at data analysts who wish to learn techniques for preparing data in Excel, then visualizing it in Power BI.
By the end of this training, participants will be able to:
Understand the principles of data analysis, objectives of data analysis, and approaches for data analysis.
Use DAX formulas in Power BI for complex calculations.
Create and use visualizations and charts for particular analysis cases.
Import with Power View to move from Excel based Power BI to independent Power BI.
This instructor-led, live training in Katowice (online or onsite) is aimed at business analysts, data analysts, and developers who wish to use the advanced features and tools in Power BI to perform complex data analysis and create interactive visual reports.
By the end of this training, participants will be able to:
Install and configure Power BI and the necessary components.
Understand and explore the advanced features, components, and tools in Power BI.
Get valuable insights on advanced data analysis and strategy.
Apply advanced data modeling techniques.
Learn how to implement advanced formulas and calculations using DAX.
Know the tips and tricks on data handling, visualization, and presentation.
Make reports and dashboards interactive to enable collaboration within Power BI.
This instructor-led, live training in Katowice (online or onsite) is aimed at technical persons who wish to gain a practical understanding of available cloud solutions, the data analysis processes needed to work with data in the cloud, and the hands-on practice to apply tools such as Power BI to analyze data.
By the end of this training, participants will be able to:
Install and configure Power BI.
Evaluate the various data solutions offered by cloud providers such as Azure.
Gain an understanding of the different structures, modeling approaches, and data warehouse designs used to store, manage and access Big Data.
Apply tools and techniques to clean data in preparation for analysis.
Build reporting and analytics solutions based on on-premise as well as cloud data.
Integrate data analytics solutions with a data warehouse.
Mitigate data security risks and ensure data privacy.
About This Course
This course will discuss the various methods and best practices that are in line with business and technical requirements for modeling, visualizing, and analyzing data with Power BI. The course will also show how to access and process data from a range of data sources including both relational and non-relational data. This course will also explore how to implement proper security standards and policies across the Power BI spectrum including datasets and groups. The course will also discuss how to manage and deploy reports and dashboards for sharing and content distribution.
Audience Profile
The audience for this course are data professionals and business intelligence professionals who want to learn how to accurately perform data analysis using Power BI. This course is also targeted toward those individuals who develop reports that visualize data from the data platform technologies that exist on both in the cloud and on-premises.
Skills gained
Learn how to Get & Transform Data to Prepare Interactive Dashboards
Power BI is one of the most popular Data Visualization tool, and a Business Intelligence Tool. Power BI is a collection of data connectors, apps, and software services, which are used to get data from different source, transforms data, and produce beautiful reports.
Power BI also allows you to publish them for your organization so that you can access them using mobiles, tablets etc. In this Power BI Tutorial, we will show you the step by step approach to connect with multiple data sources, data transformations, and creating reports like charts, tables, matrix, maps, etc
About the training
Microsoft Power BI desktop training focusing on the data layer aspect, extended to include topics on working with Power Query M and the DAX language and SQL database. Training aimed at people familiar with the basics of building Power BI reports, involved in processing and analyzing large amounts of data, for whom the standard import of data into the model is not enough. Extension with elements of M and DAX languages working with the database allows for more efficient and faster work with data.
Training objective
To get acquainted with tools that extend the possibilities in working with Microsoft Power BI desktop working with SQL database server, data services or file data. To learn the basics of working with M and DAX language and using them in creating reports and analysis.
What will Power BI improve in your work?
You will learn how to retrieve data efficiently. You will optimize ways to retrieve and transform data located on SQL Server, file sources and services. You will expand your skills in using the best analytical tool. You will increase your confidence in your job by acquiring new skills. You will dramatically increase your chances for promotion. You will radically raise your level of professional competence.
Where will you use the acquired knowledge?
You will increase the efficiency of your work related to the creation of reports and in BI tools related to SQL database. You will also notice an increase in comfort in accessing data. You will achieve a new higher quality of data presentation and updating.
What you will learn.
You will learn how to effectively use the enhanced capabilities of Power BI. You will be able to create a unified reporting system based on SQL Server data. Standardization of methods for generating reports and creating statements for analysis will no longer be a problem for you. At the same time, you will move the security of the created analyses to a new higher level.
ABOUT THE TRAINING
Microsoft Power BI desktop training from A to Z provides a comprehensive overview of the application's capabilities. It covers a cross-section of all important stages of working with data in Power BI: Extraction, Normalization, Integration, Modeling, Presentation, Publication
PURPOSE OF THE TRAINING
Working with Microsoft Power BI in the desktop version and elements of the online version, working with SQL database, data services or file data. Introduction to working with Query M language and DAX model, additionally extended to work with visualizations for R and Python languages.
WHAT WILL YPU IMPROVE IN YOUR WORK?
You will optimize ways to retrieve, transform and integrate data located on SQL Server, file sources and services. You will expand your skills in using the best analytical tool. You will increase your confidence in your job by acquiring new qualifications. You will definitely raise your level of professional competence and chances for promotion.
WHERE WILL YOU USE THE ACQUIRED KNOWLEDGE?
You will increase the efficiency of your work related to the creation of reports and in BI tools. You will also notice an increase in comfort in accessing data. You will achieve a new higher quality of data presentation and updating.
WHAT WILL YOU LEARN?
You will learn how to effectively use the enhanced capabilities of Power BI. You will learn all the essential steps of working with visualized data.
About the training
Microsoft Power BI desktop training focusing on online report publishing, aimed at people who are familiar with the basics of building Power BI reports and whose priority is to share their reports with colleagues. Expansion to include elements of online data model management allows you to effectively manage report sharing.
Training objective
To familiarize with the tools that extend the capabilities in working with Microsoft Power BI desktop with the aspect of publishing reports in the online service and using them in the creation of reports and analysis.
What will Power BI improve in your work?
You will learn how to publish reports effectively. You will optimize ways to retrieve and transform data located in a cloud service. You will expand your skills in using the best analytical tool with online data model management. You will increase your confidence at work by acquiring new skills.
Where will you use the acquired knowledge?
You will increase the efficiency of your work related to the creation of reports and in BI tools o cloud solutions. You will also notice an increase in comfort in accessing data. You will achieve a new higher quality of data presentation and updating.
What you will learn?
You will learn how to effectively use the Power BI service. You will be able to create a unified online reporting system. You will master the standardization of methods for generating reports and creating summaries for analysis. At the same time, you will take report security to a new higher level.
About the Course:
Microsoft Power BI transforms your company data into rich visuals that facilitate new ways of thinking about and organizing your data, so that you can focus on what is important to achieving your goals. This course covers both Power BI on Line and Power BI desktop.
Audience:
This course is intended for Business Managers, Report Developers, Analysts, Project Managers and Team Leads.
At Course Completion
Upon completing this course, students will have a basic understanding of the topics below, as well as an ability to utilize and implement the concepts learned.
Power BI
Power BI Desktop
Working with CSV, TXT, and Excel Worksheets
Connecting to Databases
Merging, Grouping, Summarizing, and Calculating Data
About the training Power Apps training allows you to learn how to create applications without writing code. Extensive templates, data connectors and artificial intelligence elements allow beginners to create useful applications
Purpose of the training Introduce the participant to the world of creating applications to streamline everyday activities. Learning how to work with an application involves creating efficient applications without writing code, so-called no-code or with its minimal use of low-code. Most of the elements of the created application are built by dragging and dropping with the mouse.
What will Sharepoint improve in your work? You will learn to create effective and impressive applications to support your daily activities. You will gain the ability to use the latest tool to streamline your work. You will increase your confidence at work by acquiring new skills. You will dramatically increase your chances for promotion. You will radically raise the level of your professional competence.
Where will you use the acquired knowledge? You will be able to use the applications you create in most components of Office 365 and hundreds of other applications available through built-in connectors. You will notice at the same time an increase in convenience in accessing data. You will achieve a new higher quality of efficiency and reliability in the data you process and update.
What will you learn? You will become an application developer, i.e. a developer who will be able to build tools to support the work in your organization without much trouble. At the same time, you will take your organization's security to a new higher level.
About the training
Power Automate (formerly Flow) training allows you to learn about the Power Automate application, part of the Power Platform. The tool allows you to effectively automate and streamline repetitive tasks. It will significantly increase your productivity, while allowing you to save time spent on handling processes in your company.
Purpose of the training
To introduce the participant to comprehensive automation of daily activities. Learning how to work with an application involves creating efficient flows without writing code, so-called no-code or with minimal use of low-code. Most workflows are configured by drag and drop with the mouse.
What will Sharepoint improve in your work?
You will learn to perform repetitive tasks efficiently by automating them. You will gain the ability to use the latest work automation tool. You will increase your confidence in your work by acquiring new skills. You will dramatically increase your chances of promotion. You will radically raise the level of your professional competence.
Where will you use the acquired knowledge?
You will be able to use the flows you create in most of the Office 365 applications and hundreds of other applications available through built-in connectors. You will notice at the same time an increase in your comfort in accessing data. You will achieve a new higher quality of efficiency and reliability in the data you process and update.
What will you learn?
You will improve information exchange with colleagues. You will be able to create a unified system that automates flows of documents, files and information as such. Standardization of methods for generating flows and creating workflows will no longer be a problem for you. At the same time, you will take the security of your organization to a new higher level.
This instructor-led, live training in Katowice (online or onsite) is aimed at beginner-level to intermediate-level data professionals and business analysts who wish to effectively use Power BI for data analysis and visualization.
By the end of this training, participants will be able to:
Understand Power BI's architecture and its core components.
Connect to various data sources and perform data transformations.
Create effective visualizations and interactive dashboards.
Implement row-level security and manage data access.
Microsoft Power BI is a free Software as a Service (SaaS) suite for analyzing data and sharing insights. Power BI dashboards provide a 360-degree view of the most important metrics in one place, updated in real time, and available on all of their devices.
This instructor-led, live training (online or onsite) is aimed at business managers, business analysts, data analysts, report developers, and team leads who wish to design a perfect Power BI dashboard.
By the end of this training, participants will be able to:
Design beautiful and efficient dashboards following the critical rules.
Choose the right charts based on the kind of data for display.
Format of the Course
Interactive lecture and discussion.
Lots of exercises and practice.
Hands-on implementation in a live-lab environment.
Course Customization Options
To request a customized training for this course, please contact us to arrange.
In this instructor-led, live training in Katowice (onsite or remote), participants will learn how to use Microsoft Power BI to analyze and visualize data using a series of sample data sets.
By the end of this training, participants will be able to:
Create visually compelling dashboards that provide valuable insights into data.
Obtain and integrate data from multiple data sources.
In this instructor-led, live training in Katowice, participants will learn how to use Power BI to develop custom software solutions for the Power BI and Azure platforms.
By the end of this training, participants will be able to:
Configure real-time dashboards.
Create custom visualizations.
Integrate rich analytics into existing applications.
Embed interactive reports and visuals into existing applications.
Access data from within an application.
Master Power BI Portal, Desktop, Embedded and Rest API.
The "Power BI - Data Visualization" training focuses on creating reports using Power BI tools, including importing and combining data from files and databases SQL. Participants gain skills in working with Power BI Desktop, creating data models, various visualizations, and sharing reports in the cloud. The course covers topics such as data modeling, table linking, data optimization, as well as advanced visual elements and sharing reports in various formats such as CSV, PDF and in the cloud.
Read more...
Last Updated:
Testimonials (11)
That the trainer was asking from time to time about our steps, the work was split between the rooms. So, we got the chance to work in small group.
Alina - Sustainalytics
Course - Microsoft Power Automate
The content was tough but that extra effort I had to put helped me remember and understand power BI better.
Melvin - TLI Group
Course - Power BI DAX Fundamentals
Discussing about our issues
Rr Dwi Putri Periska Sari - PT. Becton Dickinson Indonesia
Course - Power BI for Developers
What I liked the most was the coach's openness regarding the change in content as well as the approach that was previously prepared to accommodate our real needs
Ernesto Sitoe Junior - Electricidade de Mocambique
Course - Advanced Power BI
Best practices for building a data model and best practices for visual elements in a report not covered in official materials. Many examples from projects.
Abc Xyz
Course - Microsoft Power BI Data Analyst (szkolenie autoryzowane PL-300)
Machine Translated
There are many fields and functions which I haven't recognized or I haven't been familiar with. It was really good that I could get such knowledge or skills for self-development and for database creation for company.
TAKURO MATSUDA - TAKENAKA EUROPE GmbH Sp. z o. o. Oddzial w Polsce
Course - Power BI - wizualizacja danych
The second day as Power Bi is a really friendly tool, and clearly Costas knows it very well, it was really good to learn about that tool. Unfortunately we have to see Power pivot in excel first which is really not user friendly but definitely a must see first in order to understand how Power Bi works, and it makes Power Bi look super cool :)
Anne-Cecile Jacquot - Ameropa
Course - Excel to Power BI
The second day was very interesting.
It was a good training to see some possibilities within Power BI; but mostly you learn then while you work with Power BI. Fact is also that the training base has all access rights and everything works, but as soon as you try to connect to the live system, it does not work and this makes the knowledge transfer a bit difficult.
Marco Iuliano
Course - Power BI Dashboards
Training adjust the training according to our needs and knowledge. He understood participants experience with Power BI.
Cristian Tudor - Gilbarco ACIS SRL
Course - Creating Dashboards Using Microsoft Power BI
I really enjoyed the training exercise.
Edward Dan Dree Manalad - Marine Benefits, Inc.
Course - Power BI for Business Analysts
The fact that we received ready-made solutions to the given problems + demonstrating a wide range of applications + conveying a comprehensive body of knowledge.
Online Microsoft Power BI training in Katowice, Microsoft Power BI training courses in Katowice, Weekend Microsoft Power BI courses in Katowice, Evening MS Power BI training in Katowice, Microsoft Power BI instructor-led in Katowice, MS Power BI coaching in Katowice, MS Power BI on-site in Katowice, Online Microsoft Power BI training in Katowice, MS Power BI boot camp in Katowice, Microsoft Power BI classes in Katowice, Microsoft Power BI instructor in Katowice, Power BI private courses in Katowice, Evening Microsoft Power BI courses in Katowice, MS Power BI one on one training in Katowice, Weekend MS Power BI training in Katowice, Microsoft Power BI instructor-led in Katowice, MS Power BI trainer in Katowice